Plot graphs in emacs org-mode
I use Emacs as the IDE for most of my projects, one of which required plotting a graph to debug an issue. I have summarised the steps I followed to generate a graph using Emacs, with a mac.
Prerequisites
-
Download and install Xcode from App Store
-
Install command line tools
xcode-select install -
Install gnuplot - the graphs will be powered by gnuplot
sudo port install gnuplot +qt5 + x11 +aquaterm +wxwidgetsRefer this setup guide for more details
-
Emacs packages to be included in your .emacs or init.el :
gnuplot,gnuplot-mode(straight-use-package 'gnuplot) (straight-use-package 'gnuplot-mode) -
Read the primer for tables in org-mode
Generating a graph from an org file
-
Create a table with the values you would like to plot
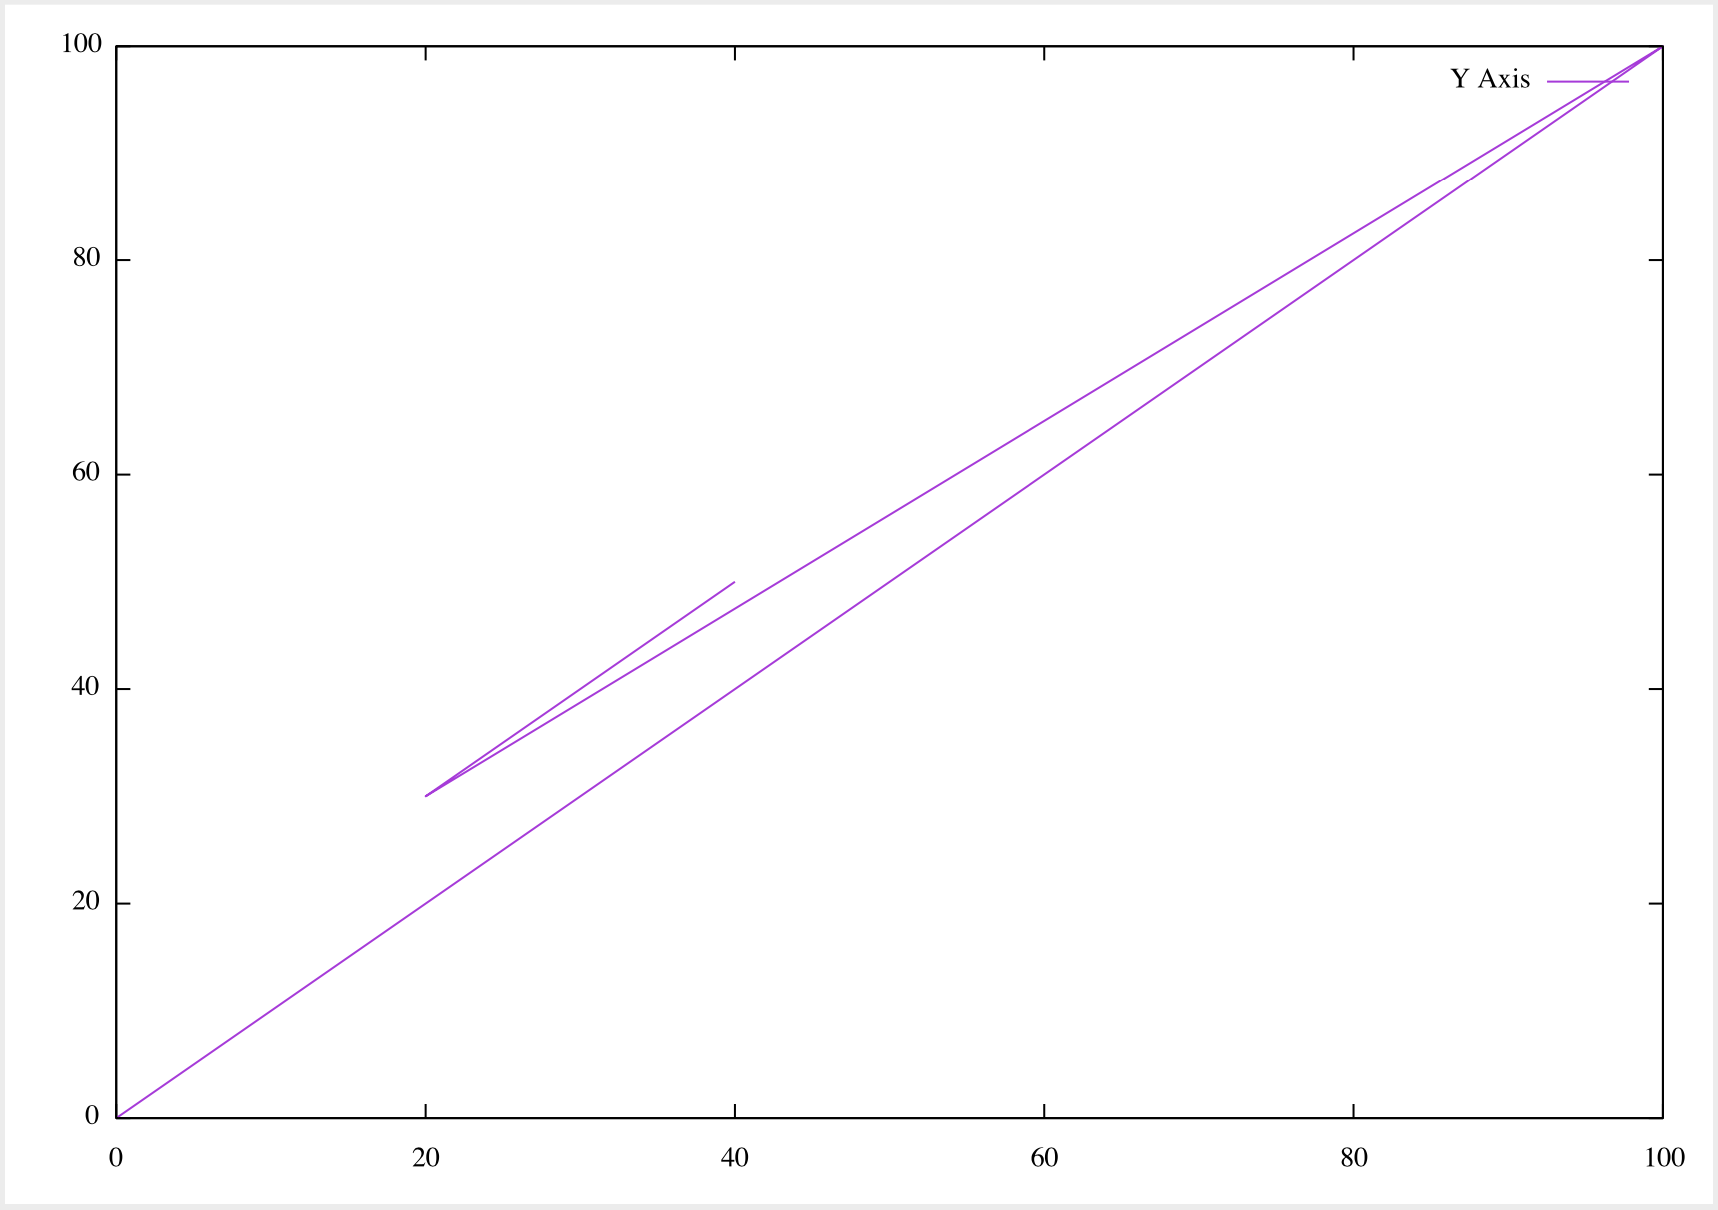
X Axis Y Axis 0 0 100 100 20 30 40 50 -
Keep your cursor inside the table and invoke the following command
M-x org-plot/gnuplotThe short cut key for the same is
C-c " g -
The graph shown below will be generated outside the emacs GUI and can be seen in a separate window.

-
There are multiple options that can be provided to gnuplot. For instance, in the above plot, since the x-axis was not mentioned in the table it considered both columns to be Y axis. Hence, the two lines - one for each column
-
Options can be provided just above the table you want to plot, in the following format
#+PLOT: ind:1 | X Axis | Y Axis | |--------+--------| | 0 | 0 | -
Some options that are useful for simple plots
-
ind -
indstands forindexof the column which will act as x-axis. For table 1, we would like our first column to serve as x-axis#+PLOT: ind:1
Figure 1: Plot based on the above options
-
with -
withdecides how to plot the graph. By default it uses lines which resulted in the above plot. Here is an example with another value.#+PLOT: ind:1 with:points
-
For more options refer https://orgmode.org/manual/Org-Plot.html
-